- In September, foreclosure filings dropped 13 percent month-over-month and 24 percent year-over-year – hitting the lowest rates since September 2005.
- Foreclosure filings across the third quarter were down 10 percent from Q3 2015.
- Foreclosure timelines saw their first annual drop since tracking data, moving from a 630-day average to a 625-day average year-over-year.
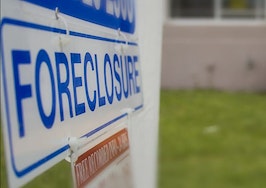
If there were any doubts about the housing market rebound, a new report from Attom Data Solutions may help you see the glass half full. According to the September and Q3 U.S. Foreclosure Market Report, foreclosure filings are at their lowest since September 2005.
One in every 1,600 U.S. properties filed for foreclosure in September, the report shows. This is a 13 percentage point month-over-month and 24 percentage point year-over-year drop.
In the third quarter, 293,190 foreclosures were filed throughout the U.S., including default notices, scheduled auctions and bank repossessions, dropping 10 percent annually. This is the fourth straight quarter illustrating annual drops in foreclosure activity, according to Attom.

[Tweet “One in every 1,600 U.S. properties filed for foreclosure in September”]
Meanwhile, Attom’s foreclosure timeline illustrated the steepest year-over-year plunge since it began tracking back in the first quarter of 2007. Last year, foreclosures took an average 630 days to complete, compared to a 625-day average for Q3.
Daren Blomquist, senior vice president at Attom Data, is calling the drop in average foreclosure timeline the “final nail in the coffin” for lingering activity that stemmed from the housing market crash a decade ago.
“For the first time, we’re seeing those timelines go down, which is evidence that the foreclosure process is starting to return to normal, and banks are dealing with fewer legacy loans left over from the housing crisis,” he said.
Average foreclosure timelines dropped annually across 19 states, including Texas, which had a 20 percentage point plunge to an average 246 days in Q3. The five states with the shortest timelines, including Texas, uphold a non-judicial foreclosure process.
On the other hand, the average time to complete a foreclosure in Q3 rose in 27 states. The average foreclosure timeline is now longest in New Jersey (1,262 days), Hawaii (1,241 days), New York (1,070 days), Florida (1,038 days) and Illinois (942 days).
“The states with the judicial foreclosure process, which is basically where every foreclosure becomes a court case and reviewed by a judge, are generally more susceptible to delays in the foreclosure process,” explained Blomquist. “Because of those delays, backlogs of loans have built up in those areas.”
In September, Illinois held the fourth-highest foreclosure filing rate, at one in every 946 properties. While relatively higher, foreclosure filings in Illinois fell 13 percentage points year-over-year.
Florida was the fifth-most-active state, with one foreclosure for every 950 homes — a drop of over 33 percentage points since last year.
Foreclosure filings in Maryland affected one in 955 housing units, down just 2 percentage points year-over-year.
“When we look at those markets where the foreclosure process is getting longer as opposed to shorter, in many of those cases we are also seeing elevated levels of foreclosure activity compared to pre-housing crisis,” Blomquist said. “There are certainly still some markets that are struggling.”
Meanwhile, a much lesser one in 1,713 homes were filed in California, down 11 percentage points year-over-year. New York’s rate was also lower, at one in every 1,727 homes, a 23 percentage point decline compared to September 2015.
Texas foreclosure filings reached one in 2,111 homes, falling almost 20 percentage points in the same 12-month period.
Among metropolitan areas with at least 200,000 residents, Atlantic City, New Jersey, posted the highest foreclosure rate, at one in every 375 housing units.
Chicago was another top city for foreclosure filings, with one in every 767 properties foreclosed in Q3.

Foreclosure starts — reaching 34,685 properties nationally in September — are down 13 percentage points month-over-month and 20 percentage points year-over-year, the report shows. Starts reached an 11-year low dating back to May 2005.
U.S. repossessions fell 32 percentage points annually in September, for a total of 27,514 real-estate owned (REO) filings. REOs are at their lowest level since February 2015, Attom says.
The majority of foreclosures (56 percent) in Q3 were transferred back to the lender at auction. The other 44 percent were purchased by third-party investors, the highest share since 2000, according to the report.
“What that [investor increase] shows to me is that foreclosures are no longer viewed as a problem in this housing market, they are viewed as an opportunity – particularly by investors,” Blomquist said.


