There a ton of built in reports in Google Analytics. And all of these reports have their uses for drilling down into what is really happening on your website.
But if you want to stay focused on what’s important to your business, then you’ll want to set up some custom reports.
I’m going to set up a custom report that deals with traffic that arrives on your site from real estate aggregation sites. I figure since I’m always asked about whether Trulia, Zillow or Realtor.com are “worth it” and since the answer is always “it depends” I might as well give you the same tool I would use to start answering that question.
It’s important to note, however, that this custom report will only tell you about traffic to your website–it won’t tell you about emails directly from the aggregators or phone call leads or anything like that. It will just tell you about traffic.
Here’s a step-by-step example on setting up the custom report.
Log in to Google Analytics
I probably don’t need to say this, but to be thorough: to make Custom Reports in Google Analytics you’ll need to have a Google Analytics account up and running. Log in to your GA (Google Analytics) account.
Make sure you’re in the “new version” of GA.

If you are in the “new version” the upper right corner of the page will look like this picture and give you an option to go back to the old version. If you’re in the old version, you’ll have the option to switch to the new version.
Click the “Custom Reporting” navigation item

By default you log in to the “Standard Reporting” section. We don’t want no stinking standard reporting. We want custom reporting. So click it and move on to the next step.
Welcome to Custom Reports!

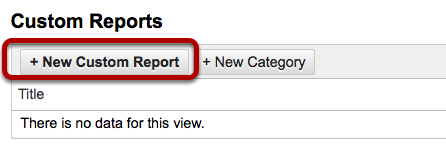
You don’t have any Custom Reports so this isn’t too exciting. Let’s fix that. Click “+ New Custom Report”
Give your Custom Report a name.

First thing we do is give the report a name. I’ll give you one of my big secrets in web analytics: when you have the opportunity to name something give it a name that is actually the question the report is answering. This only works if you know how your report is built inside and out. But it makes everything so much easier for you and anyone you might share this report with.
For example, don’t name a report “V from Trulia/Zillow/Realtor.com.” Instead try something like “What are the aggregators doing for my site?”
Focus on buiding reports that answer important questions and you’ll end up making reports that you and your team can use to take action.
Set up a data “tab”

By default your new custom report will have one tab. If you want more than one tab you can add them. For now we’re going to stick with just one. We’re going to name it “Overview”
For the tab “type” let’s select “Explorer” because this lets us drill down into the different sets of data we’re going to put in this custom report. The “Flat Table” option just puts everything in one big lump.
Select some metrics for your custom report tab.

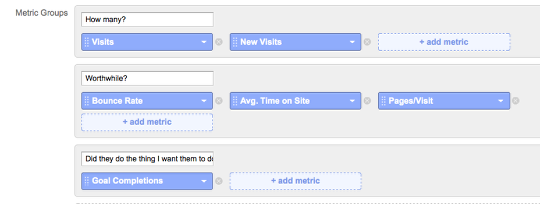
Here’s where it gets fun. This is where you pick the stuff you’re going to put in your custom report.
I encourage people to use things that are meaningful and help answer the question that you used to name the report.
Since our report is called “What do aggregators do for my site?” I have picked a few metrics that I a little deeper into that question. Please note that the last Metric Group is only useful if you have goals configured in GA.
[Secret bonus: log in to Google Analytics, click this link and you’ll have the completed version of this custom report available without having to do any of this work. Thanks for reading!]
How do you want to drill it down?

Your custom report is going to have some charts at the top and a table below with the data you selected in metrics.
In those tables, you can click a row and dig a little deeper.
“Dimension Drilldowns” is where you decide how deep and at what angle you want that drill to … um… drill.
Since our “What do aggregators do for my site?” custom report is about real estate aggregator sites sending visitors to your site, I’ve chosen “Source” so you can then drill down into Trulia, Zillow or Realtor.com if you want to. And you can go deeper if you like, down to the specific page that delivered that visit to your site.
The magic: Applying a filter.

This is the hard technical step. But you’ve made it this far so I know you can do this.
The filter will either include or exclude data based on whatever you put in these fields. Here’s how I’ve set this one up.
I’ve chosen “include” because we’re only going to include traffic that came to your site from the real estate aggregation sites.
I’ve chosen “source” because that’s what we’re looking for–the source of the traffic.
I’ve chosen “Regex” (regular expression) because I have a slightly complicated source I want to filter. I want to show traffic from trulia.com OR zillow.com OR realtor.com. I can only do this using Regex. The pipe character | means OR in Regex.
Mess around with this and you’ll get it. Regex is a lot of fun if you like puzzles, words and math all at the same time.
Apply it and you’re done.

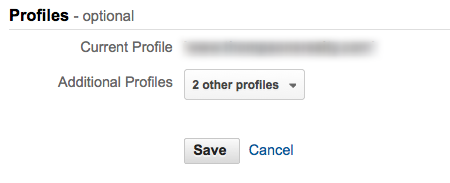
If you have several profiles in your Google Analytics you can choose to apply this custom report to all fo them. Super handy for brokers who are helping a lot of agents or agencies helping a lot of clients etc.
Hit save and you now have a report that will tell you what real estate aggregation sites are doing for your website traffic.
I bet you can think of some other similar custom reports to make (hmmmm social media? your MLS? your local media?).
Use custom reports to make reports that answer real questions for your business. Then you’ll use analytics more to listen and make your business better.

