Have you checked out the new Insights tab on your Facebook page lately? Before, stats and insights from Facebook were pretty basic unless you dive into Excel files full of data. The use of graphs and quick views of posts you’ve published makes it easier to analyze what’s working and what isn’t.
Wondering what the big deal is? The new user interface makes it easier for you to pinpoint what types of posts are working (video and photos tend to do better for reach and engagement) and who your target audience is through demographics. One of my favorite updates is being able to see when your fans are online and what the popular times they saw your content under the Posts tab.
The quick tour of the new Insight panel takes you through the four tabs at the top: Overview, Page, Posts and People. Let’s break them down.
Overview:
Here you will get a breakdown of the last seven days of the basics: page likes, post reach, engagement and your most recent posts.
Page:
This tab gets broken down into likes, reach and visits. You’re able to use the scroll bar the top to change the range of dates you are viewing.
You also get the total number of likes on your page by day as well as what has changed between unlikes, organic and paid likes.

Posts:
Visually, the new Posts tab is well designed and very easy to decipher. You can view your posts in order of when they were published; see whether it was a photo, link or video; see the audience you were targeting (public or a small set of friends/fans); and view the total reach and engagement. New filter options are also available for easy access specific to what you’re looking for.
My favorite part is the When Your Fans Are Online tab. You are able to access when exactly your audience is viewing your content (perfect for figuring out the sweet spot for your scheduled posts!). I’m anxious to see if Facebook follows in Google’s footsteps with some kind of live, real-time analytics on this tab.
The last subtab clarifies for you exactly what type of post works best for your business page. That beautiful video you shot of the local neighborhood of your current listing did really well in reach and engagement compared to just a simple link you put up on your page. Now you know — time to shoot more video!

People:
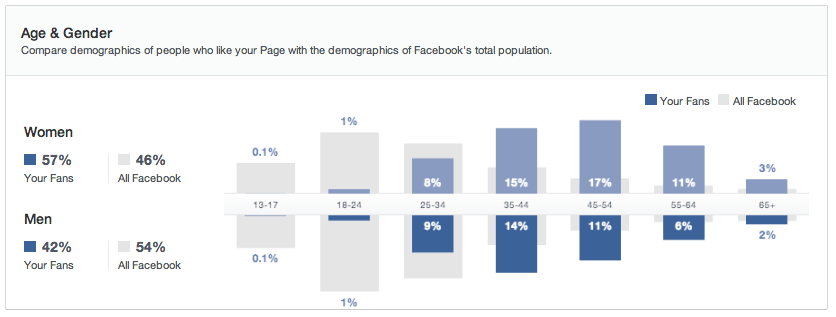
This tab gives you good insight into the demographics and location of your audience compared to all of Facebook. It’s then broken down into three parts: your fans, the people your content reaches and the people who are engaged. For example, you can see that all of Facebook is made up of 46 percent women, but for your specific business page women make up 57 percent of your fans. Pretty cool information to have at your fingertips.
All of this new information gives you a more direct and straightforward way to view your posts and the people who are viewing your content. Don’t worry. You can still export the data by page or post level into an Excel file like before if that’s your thing. Jon Loomer has a great video highlighting the new Facebook insights. Check it out!
This update isn’t available to everyone yet, but if you do access it keep in mind if you go back to the old view, you can’t opt back in to the new interface until Facebook releases it to everyone.
Do you think these insight changes to Facebook pages will help you improve and/or change your content strategies on Facebook?
How can you tie in timing and your core audience into your strategy? Leave me a comment below!


