This is the first installment of a new Inman series digging into, and explaining, routine real estate economic metrics and how they’re used to illuminate the current housing market and inventory crises. Check back tomorrow for the second installment on new home sales.
Each month, the National Association of Realtors (NAR) performs a ritual.
In emails and reports, the influential trade organization sends out a data set described as “pending sales.” Sometimes the numbers are up, sometimes they’re down. But either way, Inman and others regularly parse the numbers down and turn them into headlines about the health of the housing industry.
But what, exactly do the numbers mean? Where do they come from, and just how many conclusions can we draw from them?
The idea with pending sales numbers is that the offer a window into what the market is doing now and what it’ll do in the future. They’re a kind of crystal ball.
But to get a better sense of what exactly the numbers say — and what agents need to know — Inman reached out to a handful of economists and obtained years worth of data. The takeaway from all of this is that pending sales numbers offer a useful window into the state of the housing market — and that there may be more nuance to the data than is immediately obvious.
Here’s what you need to know:
Table of Contents
- What exactly counts as a “pending sale”
- Why pending sales matter
- What the latest numbers say
- What we can glean from the latest pending sales data
- Additional resources
What exactly counts as a “pending sale”
To begin, let’s get some definitions out of the way, because while “pending sales” sounds fairly self-explanatory, there’s maybe more to the concept than meets the eye.
As the name implies, a pending sale represents a home that has gone under contract, but which hasn’t closed yet.
However, the National Association of Realtors (NAR) also produces a “Pending Home Sales Index” (PHSI), which is actually a metric that looks at the entire market by taking a sample of just some pending sales. According to a statement on NAR’s latest index, the sample typically represents roughly “20 percent of transactions for existing-home sales.”
Pay special attention to the “existing-home” part of that quote; the PHSI measures pending contracts on homes that were already built, as opposed to new builds.
The PHSI is also used to compare sales to the level of contract activity that was happening in 2001, when NAR first started looking at this data. So, if the PHSI is at 100, activity would be the same as it was in 2001. If it’s below 100, activity would be lower, and if the PHSI is higher than 100 — as it was in the numbers NAR reported in May — activity is higher than it was in 2001.
This may all sound a little wonky.
But the important thing to remember here is that there’s a difference between a simple pending sale, when it comes to a specific home an agent is selling, and the concept and data set that economists use. In other words, the PHSI is a comparative measure of the overall industry, and that’s typically what news stories about pending sales are focused on.

Why pending sales matter
Pending sales may be fairly easy to define, but that doesn’t entirely answer an important question: Who cares?
Or, more specifically, why look at pending sales numbers as opposed to just focusing on, say, closed sales?
In fact, there are a few reasons.

Matthew Gardner
For starters, pending sales help observers understand where the market is going. Matthew Gardner — chief economist for Windermere Real Estate — told Inman that pending sales are “more of a leading than a lagging indicator.”
“It can give you an idea of where closed sales will be a little bit further down the road,” he said. Gardner went on to explain that, typically, about 80 percent of pending sales close, and that those closings generally happen between 30 and 60 days in the future.
There are other ways to use the data as well. Realtor.com Chief Economist Danielle Hale noted that as part of their ability to foreshadow what’s happening in the market, pending sales data can highlight the impact of disruptive events.

Danielle Hale
For example, when the housing bubble popped in 2008, closed sales numbers initially stayed strong as existing contracts played out. But pending sales quickly fell off, which proved to be an early warning sign of trouble.
Hale said that pending sales also offer early insights into the way other disruptive events, such as weather disasters, are impacting the market.
“They kind of disrupt pendings more than closings,” Hale explained of natural disasters.
Daryl Fairweather, chief economist for Redfin, said that very thing happened in February, when wind storms in parts of the U.S. led to some homes falling out of escrow before closing.
Another useful way to use pending sales numbers is to glean from them information about what kind of market a particular place is in.

Daryl Fairweather
For instance, Fairweather said that in a seller’s market, homeowners “have more power to take an offer that’s going to be really likely for the deal to close.”
“So more would go from pending to sold than they would in a buyers market,” she explained.
Fairweather said that the U.S. has been in a “serious seller’s market for a long time,” so this particular use of the data is arguably less necessary right now. But the point is that pending sales numbers can offer indicators of where the market is headed, who as the upper hand, and what else has been going on that might impact housing.

What the latest numbers say
As Inman previously reported, NAR released new data last week showing that pending sales were down 4.4 percent in April compared to March. Contract signings were up 51.7 percent year over year, though multiple economists pointed out in conversations with Inman that April of 2020 was the height of the pandemic-induced housing slowdown — meaning a year-over-year comparison isn’t that useful in this particular case.
The PHSI also hit 106.2 in April.
In a statement about this data, NAR said April’s numbers “took a backward step,” though the Midwest did see “month-over-month gains in terms of pending home sales contract transactions.”
Hale, speaking to Inman about the numbers, said the Midwest seems to have bucked the broader trend thanks to its comparatively more affordable housing.
“We also see a bit more inventory in those midwestern markets as well,” she added.
Looking back further over time, NAR’s data — which it provided to Inman — shows that the current PHSI is right in the middle of the pack compared to other months. Indeed, over the last two decades the average PHSI was 104 — two points lower than April’s figure.
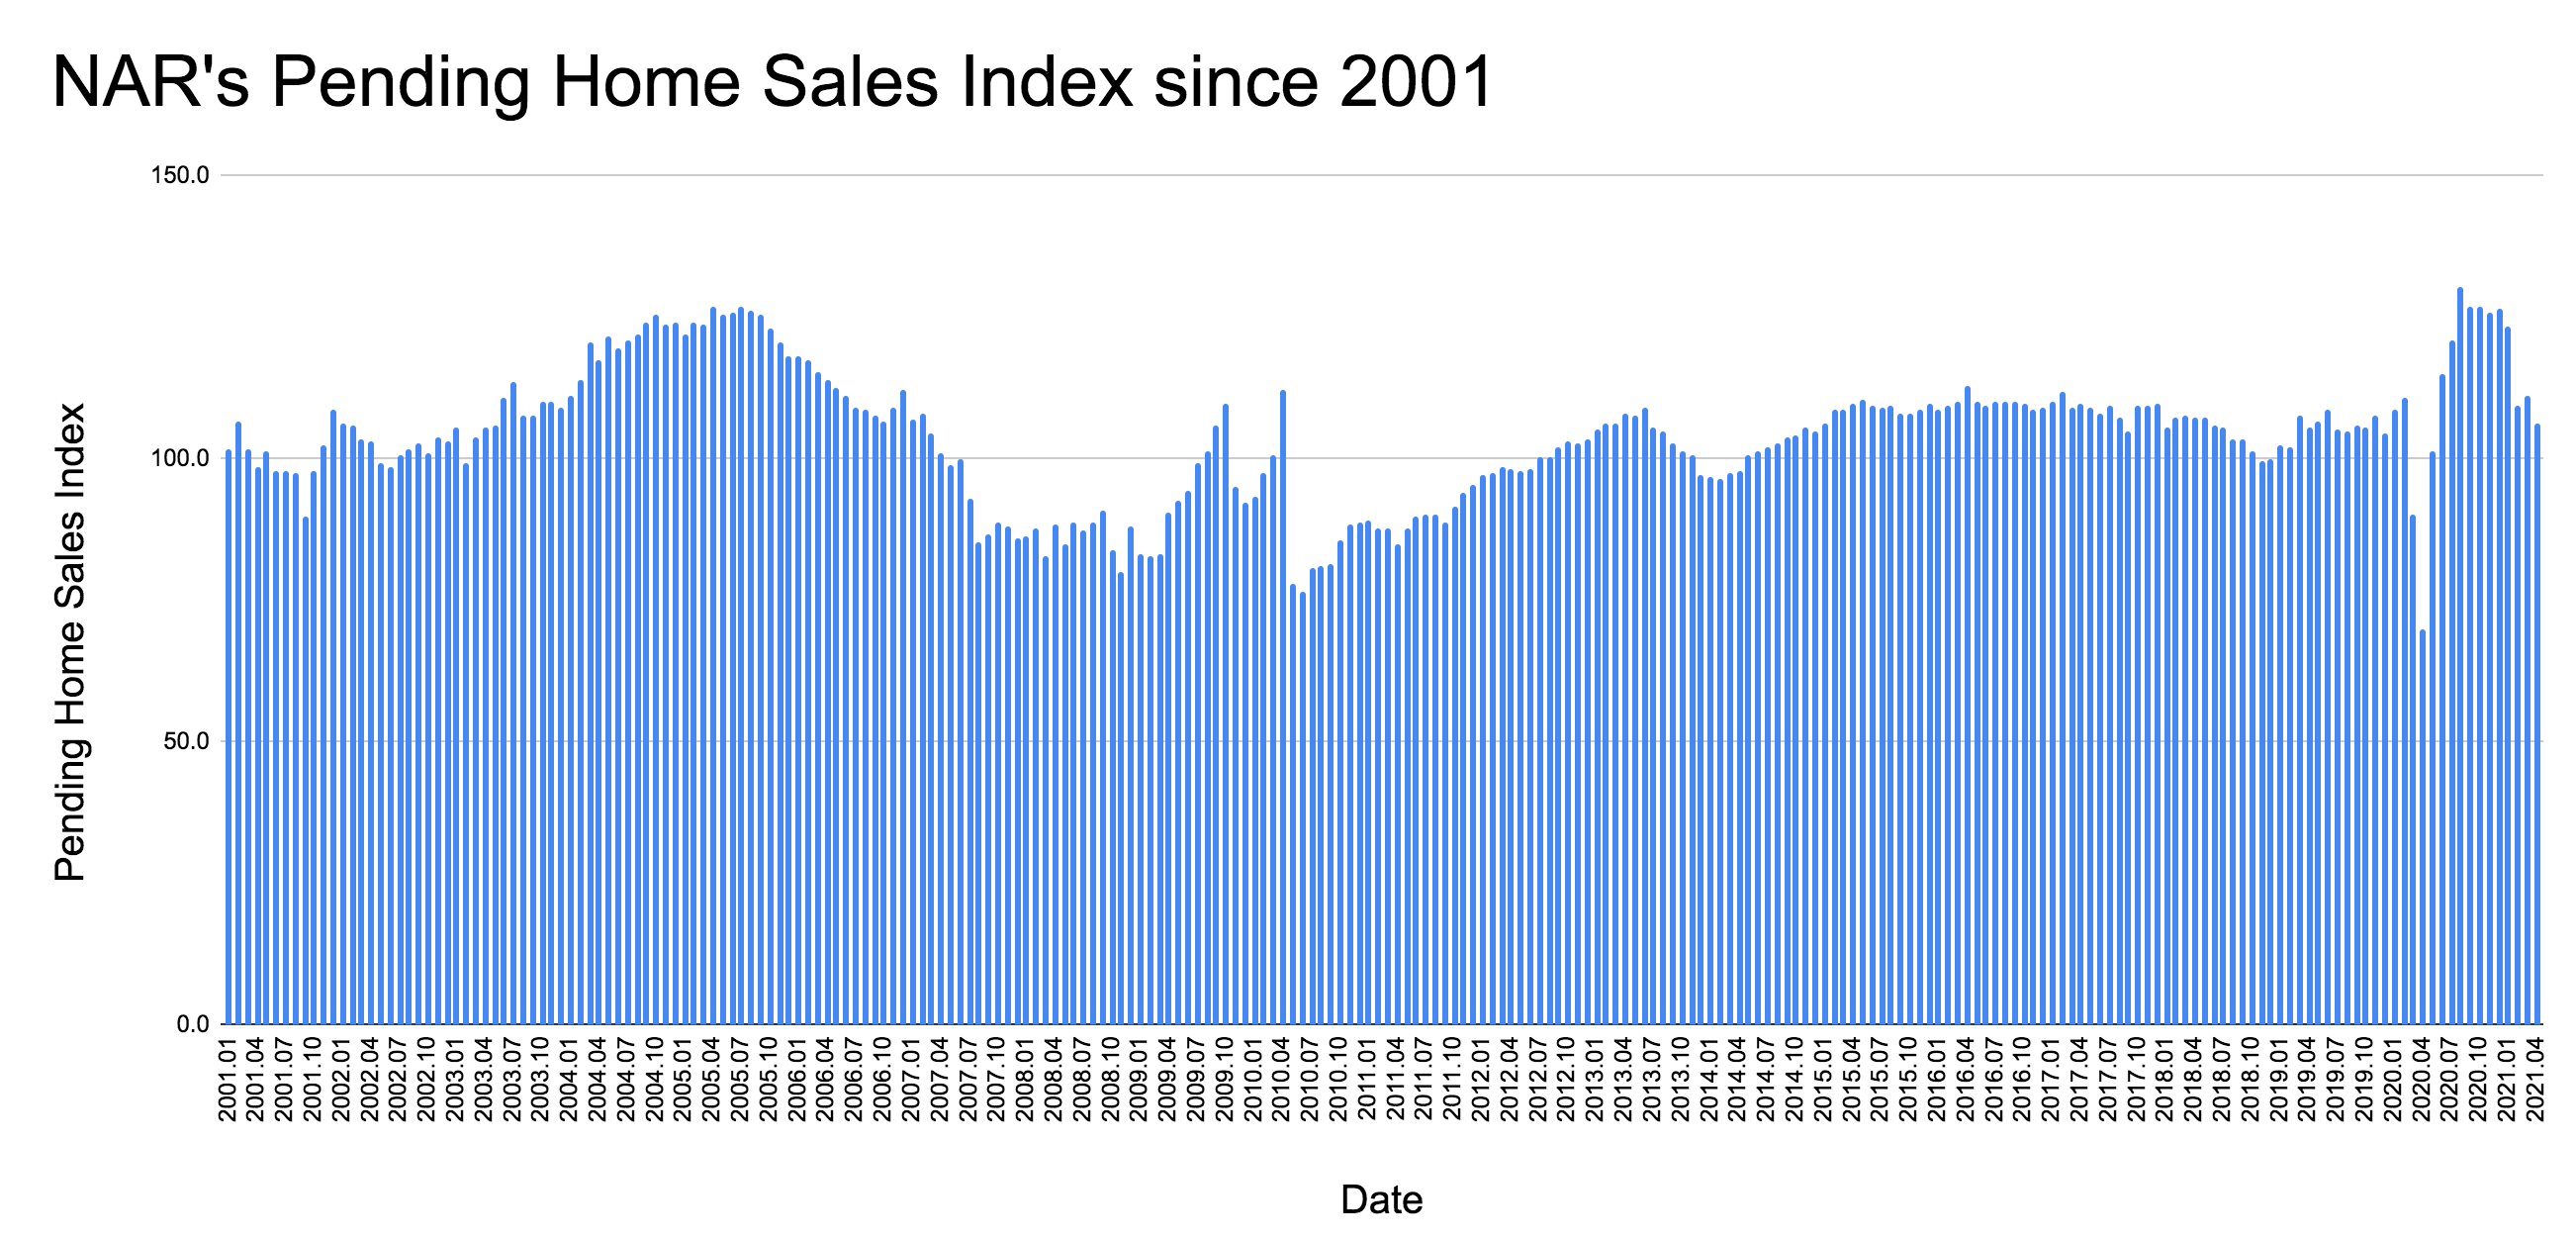
Credit: Jim Dalrymple II via NAR data
On the other hand, the chart above — which shows the PHSI since January of 2001 — captures the rollercoaster real estate has experienced over the last year. It reveals that in the early days of the pandemic pending sales dropped off a cliff and fell to their lowest point since the data has been collected.
By August, however, the PHSI had shot up to 130.3, its highest point ever, before falling in the earlier months of 2021 amid an inventory shortage.
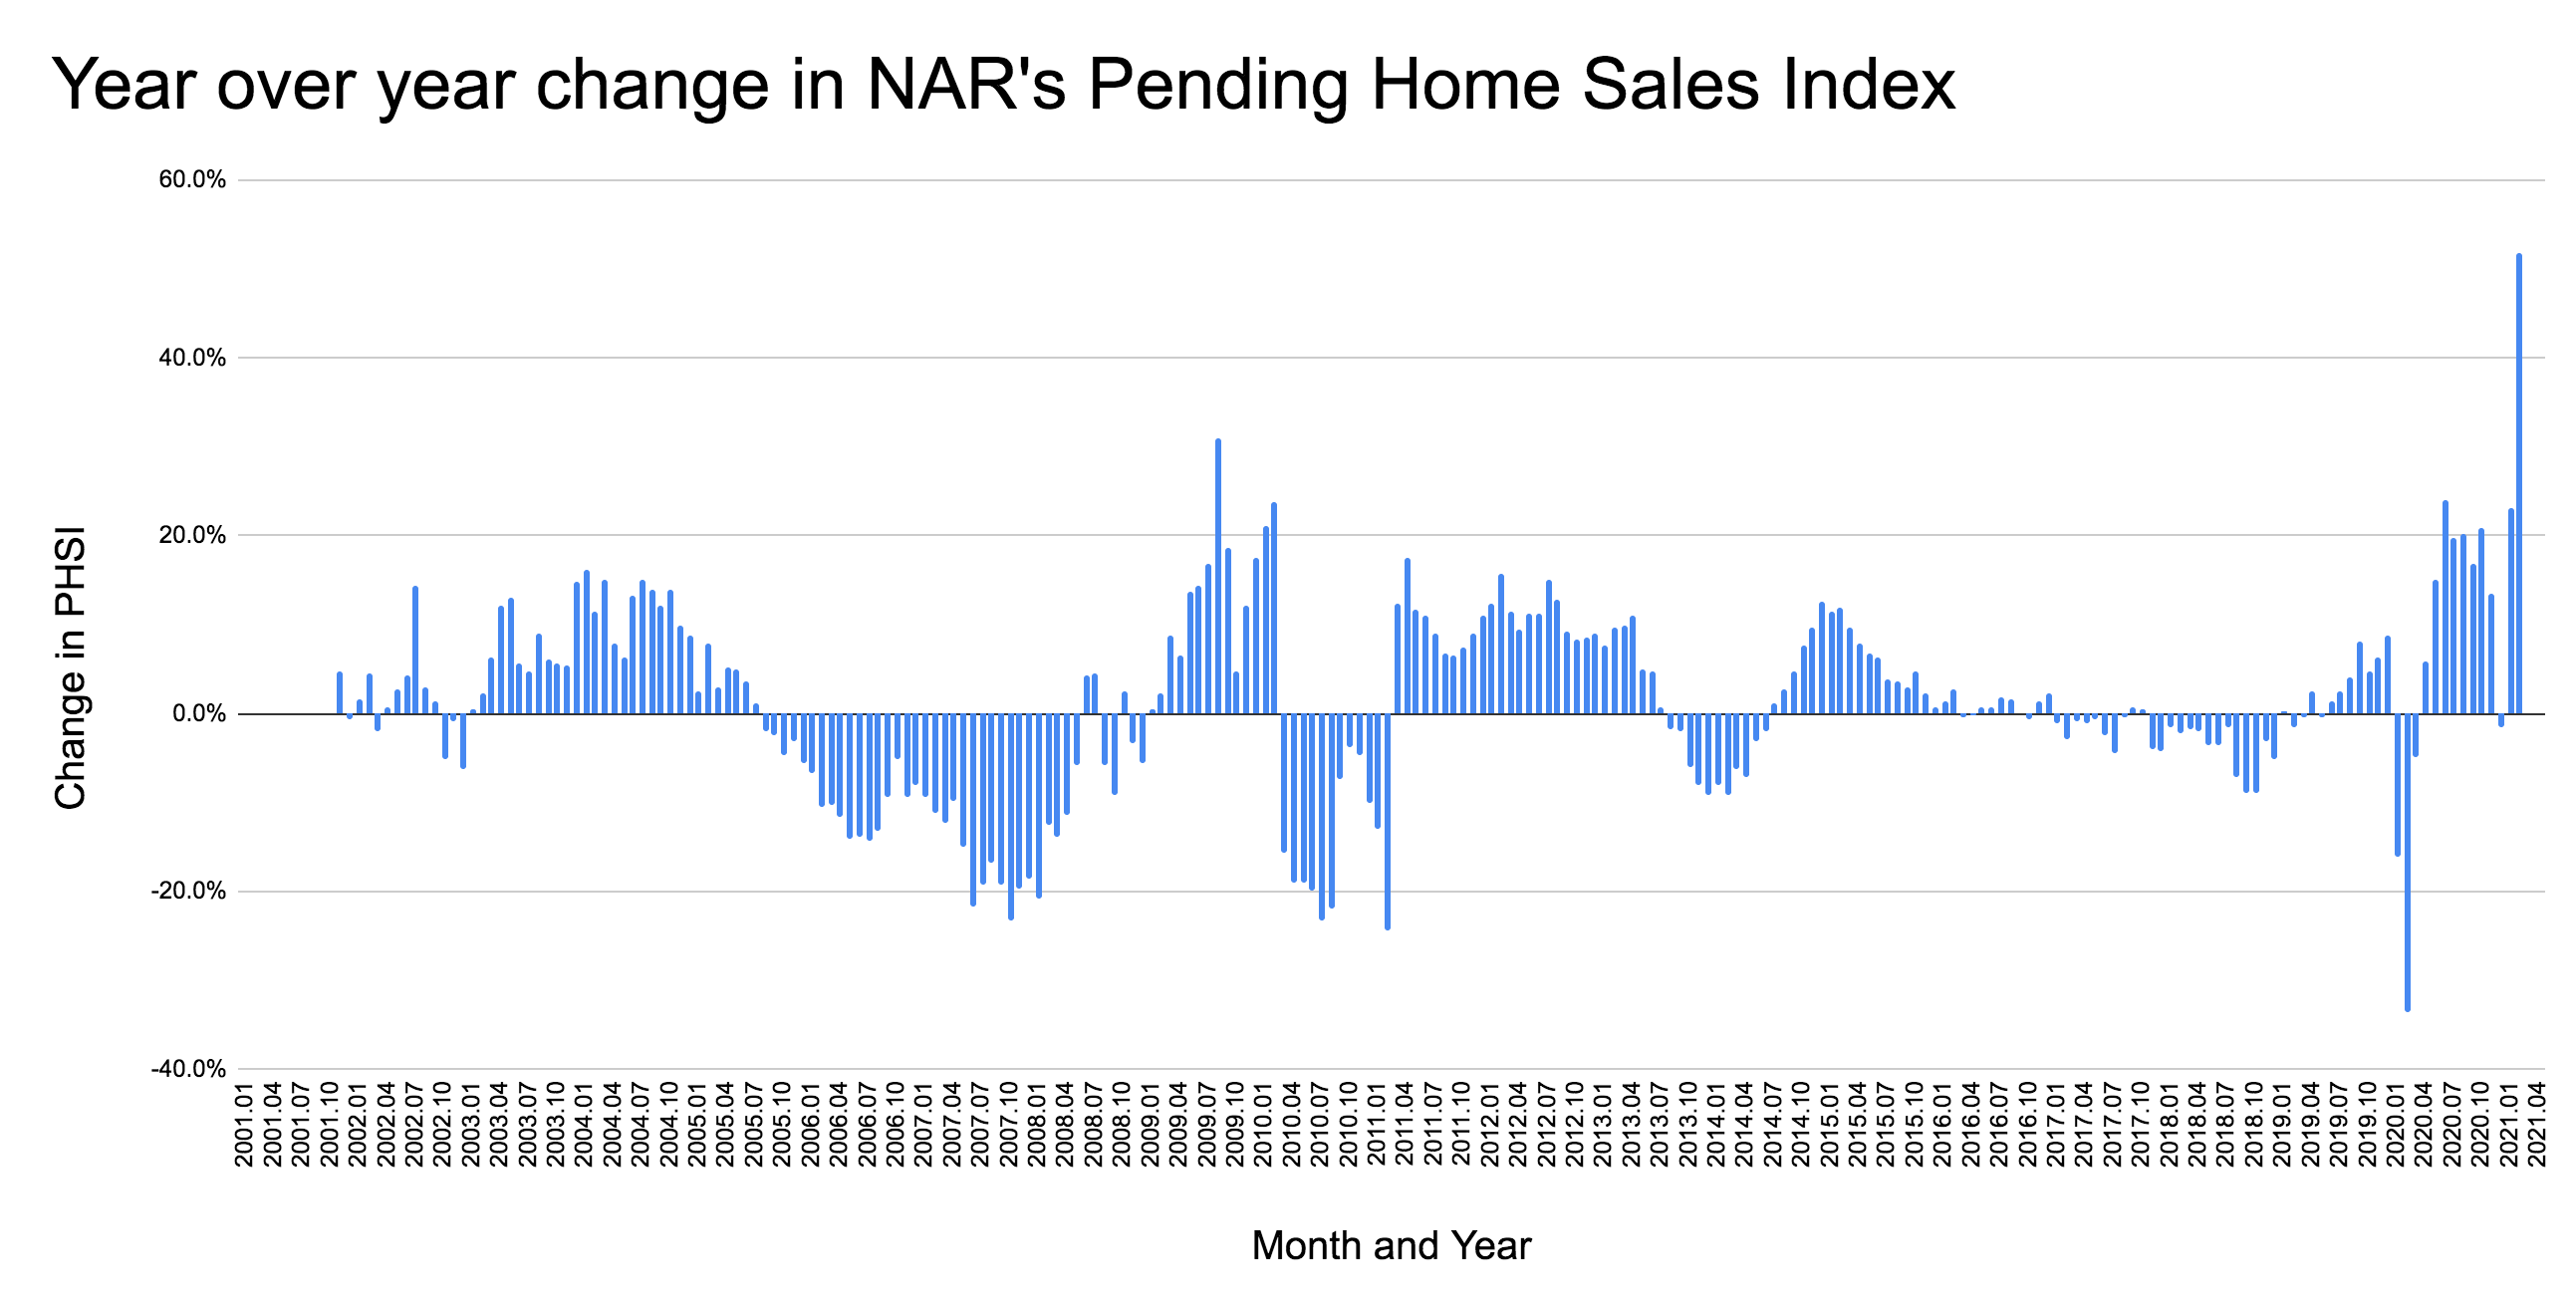
Credit: Jim Dalrymple II via NAR data
Looking at year-over-year change also puts into perspective just how wild the current situation is. Before 2021, the biggest year-over-year change happened in 2009, when pending sales jumped more than 30 percent — far lower than April’s 51.7 percent.
Again, there’s a limit to how much that change means in the context of COVID-19, but it’s still remarkable to witness never-before-seen turnarounds, even if they are the result of the pandemic.
What we can glean from the pending sales data
So we know that pending sales foreshadow the future of the market, and that April’s numbers were down. Does that spell trouble?
The economists who spoke with Inman, at least, don’t really think so.
Gardner said that when there are declining numbers — as happened in April — “some people are going to conflate that with a collapse.” But he cautioned that a dip in pending sales doesn’t mean there’s a bubble forming.
“Don’t conflate that with a collapse,” he said.
In reality, the economists who spoke with Inman for this story attributed drops in pending sales numbers to an especially constrained supply. And while that can be frustrating for buyers caught in a cycle of endless bidding wars, it also doesn’t mean the market is headed for a repeat of 2007 and 2008.
“We’ve never seen this low of inventory ever,” Gardner said. “That is what’s going to hit pendings. It’s not a lack of demand, it’s a lack of supply.”
Gardner specifically anticipates a less brutal market in the future as interest rates rise and tamp down some of the demand that has been fueling the current inventory shortage.
Hale also doesn’t believe there is a bubble coming, instead telling Inman that she expects to see a “roughly steady pace of home sales ahead.”
On the other hand the good news for consumers hoping to buy is that, according to Fairweather, the market is at least “probably not going to get more competitive than it is now.”
She added that the market will “probably return to that same status quo” that prevailed before the pandemic. Which is to say, a seller’s market, but not one that is perpetually as competitive as it is amid current conditions.
What this means for agents is that there are likely challenging times ahead, though the challenges are different than those that lie in the past. But whatever the future brings, Gardner argued that in order to succeed agents and brokerages need to have a robust understanding of essential data points, such as pending sales, that shed light on where the market is going.
“In order to advise correctly,” Gardner concluded, “you’ve got to know the numbers.”